The world’s most expensive healthcare does not deliver the longest life
More than five decades of data show that higher healthcare spending usually accompanies longer lives. The United States, however, is a striking exception.
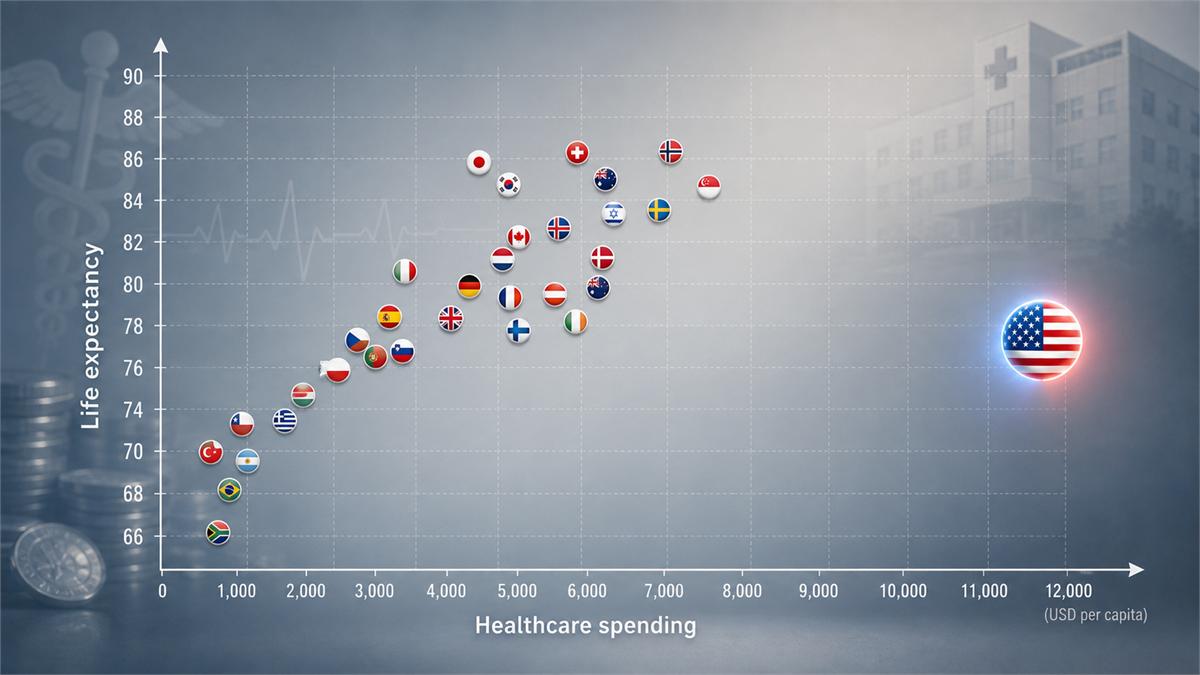
Table of contents
Healthcare spending vs. life expectancy
SH.XPD.CHEX.PP.CD). They are not nominal dollars converted at market exchange rates. That means $1 of healthcare spending in India and $1 in the United States are made more comparable in real purchasing power — though PPP still does not capture every difference in wages, technology prices or quality of care.
Source: WHO GHED / OECD / UN via Our World in Data (2023)
| -- | Average |
This scatter plot compares healthcare spending per person with life expectancy across 51 countries. The dashed lines mark the group averages: about $3,986 in spending and 79.74 years of life expectancy. The United States sits far to the right on spending, yet below many peer countries on longevity.
Which countries get the most life from each dollar?
The scatter plot shows how much countries spend and how long people live. A second question is just as important: how many years of life expectancy does each country obtain for every hundred dollars spent per person?
The metric below is simple:
Years of life per $100 = life expectancy ÷ healthcare spending per capita × 100
A higher score means more years of population life expectancy associated with each hundred dollars of healthcare spending. The inverse column in the table — USD per year of life — shows how expensive each year of life expectancy is in spending terms.
Source: WHO GHED / OECD / UN via Our World in Data (2023)
| -- | Average |
What the efficiency ranking shows
Several patterns stand out:
- India leads the ranking with about 24.7 years of life expectancy per $100 spent. Indonesia, Peru, China and Mexico also rank near the top. These countries spend little per person, so even moderate longevity produces a high ratio.
- Costa Rica is one of the most instructive cases. It reaches 80.8 years of life expectancy while spending only about $1,565 per person — roughly 5.2 years per $100. Few countries combine high absolute longevity with such low expenditure.
- Among wealthier countries, Greece, Chile, Israel, Spain, South Korea and Italy convert spending into longevity more efficiently than most of Western and Northern Europe.
- Japan, despite having the highest life expectancy in the set (84.71 years), ranks only around the middle on efficiency because it also spends substantially more per person.
- The United States ranks last. With 79.3 years of life expectancy and $12,023 in spending per person, it obtains only about 0.66 years of life per $100 — or roughly $152 in healthcare spending for each year of life expectancy. That is more than twenty times less efficient than Costa Rica on this ratio, and far below the group average of about 3.4 years per $100.
How to interpret this metric
This ratio is useful, but incomplete. It does not prove that low-spending countries have better healthcare systems, nor that simply cutting budgets would lengthen lives.
A structural caveat matters most here. Life expectancy across this set ranges only from about 65 to 85 years, while healthcare spending per person ranges from a few hundred dollars to more than $12,000. Because the ratio divides a relatively narrow outcome by a highly variable cost, poorer, low-spending countries almost automatically fill the top of the ranking, and richer, high-spending countries fill the bottom — even when their absolute longevity is higher. That pattern is largely a property of the metric, not evidence that low-income systems are more effective overall.
Several further points follow from this:
- Much of the early gain in longevity comes from sanitation, vaccines, nutrition and basic care. Once those gains are in place, each additional dollar tends to buy smaller improvements — so “years per dollar” falls as spending rises.
- Countries with low spending often have younger populations and different disease patterns; a high efficiency score can coexist with large unmet medical needs, regional inequality or limited access to complex treatment.
- Rich countries spend more in part because they treat older populations, pay higher wages to health workers and purchase more expensive technologies.
- Life expectancy is shaped by many factors outside the healthcare budget: diet, smoking, obesity, violence, traffic safety, pollution and social conditions.
The more informative comparisons are therefore those that hold longevity roughly constant — for example among countries that have already reached a high life expectancy — rather than ranking India against Japan on the same scale. The next section applies that filter.
A fairer peer group: life expectancy of at least 78 years
The full ranking mixes countries at very different stages of the health transition. A clearer question is: among countries that have already reached a high level of longevity, which convert healthcare spending into years of life most efficiently?
The chart below keeps only the 36 countries with life expectancy of at least 78 years in 2023. That threshold includes the United States (79.3 years) while excluding lower-longevity, very-low-spending countries that dominate the unrestricted ranking for largely structural reasons.
Source: WHO GHED / OECD / UN via Our World in Data (2023)
| -- | Average |
What the peer-group ranking shows
- China and Costa Rica lead this restricted set. China reaches 78.2 years at about $1,086 per person (7.2 years per $100). Costa Rica reaches 80.8 years at about $1,565 (5.2 years per $100) — one of the strongest combinations of high absolute longevity and modest cost.
- Among richer peers, Greece, Chile, Israel, Spain, South Korea and Italy remain clearly more efficient than most of Northern and Western Europe.
- Japan still has the highest life expectancy in the group (84.71 years), but only middling efficiency because spending is higher.
- The United States ranks last even in this peer group. With 79.3 years of life expectancy and $12,023 in spending, it obtains about 0.66 years of life per $100 — far below the peer-group average of about 2.0 years per $100, and more than three times less efficient than Spain, South Korea or Italy.
This does not erase every caveat about prices, wages and population age structure. It does, however, answer a sharper question: once countries have already crossed a high longevity threshold, the United States is still the clearest high-cost outlier.
Does a larger share of GDP buy a longer life?
Absolute spending per person is only one way to measure the cost of healthcare. Another is how large a share of the national economy goes to health. A country may spend modestly per person and still devote a large fraction of GDP — or the reverse.
Ukraine is omitted from this section because 2023 current health expenditure as a share of GDP is not available in the WHO / Our World in Data series used here (latest reported year ends earlier). The comparison below covers the remaining 50 countries.
Source: WHO GHO via Our World in Data (2023)
| -- | Average |
The dashed lines mark the group averages: about 8.6% of GDP and 79.91 years of life expectancy. The United States again sits far to the right — at roughly 16.7% of GDP — while several high-longevity countries cluster near or below the average share of GDP.
The next charts ask a different efficiency question: how many years of life expectancy does each country obtain for every percentage point of GDP devoted to health?
Source: WHO GHO / UN via Our World in Data (2023)
| -- | Average |
What the GDP-share ranking shows
- Indonesia and India lead with about 26.4 and 21.5 years of life per 1 percentage point of GDP. Turkey, Luxembourg, Peru and Mexico also rank near the top. Low shares of GDP produce high ratios even when absolute longevity is only moderate.
- Costa Rica again stands out among higher-longevity countries: about 80.8 years of life expectancy at roughly 6.9% of GDP, or about 11.8 years per percentage point.
- Among richer economies, Ireland, Israel, Italy and South Korea convert GDP share into longevity more efficiently than much of Western and Northern Europe.
- Japan has the highest life expectancy in the set (84.71 years) but only about 7.9 years per percentage point, because health spending is also a relatively large share of GDP (10.7%).
- The United States ranks last again. With 79.3 years of life expectancy and 16.7% of GDP, it obtains only about 4.8 years of life per percentage point of GDP — well below the group average of about 10.2.
How this metric differs from dollars per person
Spending as a share of GDP and spending per person answer different questions:
- USD per person compares the absolute resource intensity of healthcare systems after purchasing-power adjustment.
- % of GDP asks how large a claim healthcare makes on the whole economy. Richer countries can spend more per person while keeping a similar GDP share — or, as in the United States, both a very high absolute spend and an unusually large GDP share.
- The same structural caveat applies: because longevity varies much less than the size of the health claim on GDP, lower-spending economies again tend to dominate the “most efficient” list. That is not, by itself, a quality ranking of healthcare systems.
- A high efficiency score on either ratio does not mean that a system is “better”. It mainly shows that longevity is high relative to the measured resource claim.
- Countries with younger populations, lower prices for care or health gains driven by sanitation and basic services can look highly efficient on these ratios without offering the same depth of advanced medical care.
Together with the per-capita comparison, the GDP-share view reinforces the same core finding: the United States is an extreme outlier on cost, whether measured in dollars or as a share of the economy, without a matching advantage in life expectancy. The next section applies the same high-longevity filter used for the dollar ranking.
GDP-share efficiency in the same peer group
The unrestricted GDP-share ranking has the same structural problem as the dollar ranking: countries with a small health claim on GDP rise to the top almost automatically. Applying the same filter — life expectancy of at least 78 years — asks a sharper question: among countries that have already reached high longevity, which convert each percentage point of GDP devoted to health into the most years of life?
Source: WHO GHO / UN via Our World in Data (2023)
| -- | Average |
What the GDP peer-group ranking shows
- Luxembourg, China, Ireland, Costa Rica and Israel lead this restricted set. Luxembourg reaches 82.2 years at about 5.8% of GDP (14.2 years per percentage point). Costa Rica again combines high absolute longevity with a comparatively modest GDP share.
- Among larger high-income economies, Italy, South Korea, Greece and Spain convert GDP share into longevity more efficiently than much of Northern and Western Europe.
- Japan remains near the lower half of the peer group on this ratio (7.9 years per percentage point) despite the highest life expectancy, because health spending is also a large share of GDP.
- The United States ranks last again. With 79.3 years of life expectancy and 16.7% of GDP, it obtains about 4.8 years of life per percentage point — well below the peer-group average of about 9.2.
Together with the dollar-based peer ranking, the pattern is consistent: once longevity is held roughly constant at a high level, the United States remains the clearest high-cost outlier on both absolute spending and the economy-wide health claim.
Standout countries: what the rankings really highlight
The charts rank dozens of countries. A smaller set of cases carries most of the story. The examples below are grouped by the role they play in the comparison — not by a claim that any single system is universally “best”.
Costa Rica: high longevity at modest cost
Costa Rica is the strongest positive counter-example. It reaches about 80.8 years of life expectancy while spending only around $1,565 per person and about 6.9% of GDP. In the peer group of countries above 78 years, it remains near the top on both dollar efficiency and GDP-share efficiency.
Why this combination is so instructive:
- It shows that crossing a high longevity threshold does not require U.S.-level spending.
- Strong population outcomes can rest on broad access to basic and primary care, public health measures and social conditions, not only on high-tech medicine.
- Because Costa Rica clears the 78-year filter, its high efficiency score is harder to dismiss as a pure “low-base” artefact of very short life expectancy.
Costa Rica should not be romanticised as a frictionless system. Regional inequality and limits in complex care still matter. As a comparative case, however, it demonstrates that strong longevity is possible far below American cost levels.
Japan: longest lives, middling efficiency
Japan has the highest life expectancy in the set — about 84.7 years — while spending roughly $4,800 per person and about 10.7% of GDP. That is far less than the United States, but enough to place Japan only in the middle or lower half of the efficiency rankings.
The lesson is not that Japan “fails”. It is that maximum longevity and maximum spending efficiency are different goals:
- Japan has already captured many cheap gains in survival; further years are expensive.
- An older population and a mature medical system raise the resource intensity of care.
- Diet, social cohesion, low violence and strong health behaviours support longevity alongside the healthcare budget.
Japan therefore sits opposite the United States in one respect — much longer lives at much lower cost — and alongside many rich peers in another: once longevity is already very high, each additional year looks costly on a simple ratio.
Spain, Italy, South Korea and Israel: efficient high-income peers
These countries combine high absolute longevity with clearly better efficiency than the United States and much of Northern and Western Europe. Life expectancy is typically in the 82–84-year range, while spending per person stays far below U.S. levels (often around $3,000–$4,100 PPP). On GDP share they also convert each percentage point into more years of life than the American system.
Common reasons for their stronger peer comparison:
- Universal or near-universal coverage reduces delayed care and catastrophic financial barriers.
- Lower unit prices for care and medicines than in the United States stretch each dollar further.
- Relatively strong primary care and prevention help avoid some expensive late-stage treatment.
- Population risk profiles — diet, smoking trends, road safety, violence — often impose a smaller longevity penalty than in the U.S.
They are the fairest “rich-country” benchmarks for asking whether American spending is buying what peer societies achieve more cheaply.
Greece and Chile: strong results at mid-range spending
Greece and Chile stand out inside the 78+ peer group: life expectancy above 81 years with spending near $2,900–$3,000 per person. That puts them among the most efficient higher-longevity countries on the dollar metric.
What makes them distinctive:
- They show that mid-range budgets can still support high longevity when access and public-health foundations are in place.
- Their advantage over much richer spenders is partly price and wage structure, not magic productivity alone.
- They also illustrate that Europe and Latin America contain efficient peers outside the usual Germany–France–Nordics reference set.
As with all mid-income or fiscally constrained systems, unmet need and quality gaps may coexist with a favourable ratio. The comparative point remains: high longevity does not require the spending intensity of Switzerland, Norway or the United States.
China: low spend inside the high-longevity club
China just clears the peer-group threshold at about 78.2 years, while spending only around $1,086 per person and under 6% of GDP. That combination places it at or near the top of the restricted efficiency rankings.
The interpretation needs care:
- China benefits from a still-moderate cost base and large earlier gains in sanitation, vaccination, nutrition and basic care.
- Life expectancy is high enough to enter the peer club, but only narrowly; the efficiency lead partly still reflects a smaller denominator.
- Rapid ageing, rising chronic disease and expanding advanced care mean this ratio may look less exceptional in future years.
China is therefore a standout in the current 2023 snapshot, especially for readers interested in large emerging systems — but it is not a stable template for already-rich countries.
Luxembourg and Ireland: small GDP share, long lives
These two countries matter mainly for the % of GDP lens. Both have life expectancy above 82 years while keeping health spending near 6% of GDP (Luxembourg about 5.8%, Ireland about 6.6%). That produces very high “years per percentage point” scores in the peer group.
Why they look different from the dollar ranking:
- They are very high-income economies. A modest share of a large GDP can still fund substantial spending per person.
- Luxembourg and Ireland therefore show that economy-wide burden and dollars per resident are not the same question.
- Their strong GDP-share efficiency does not by itself prove uniquely superior clinical performance; it shows that long lives need not consume an American-sized slice of national output.
India and Indonesia: leaders of the unrestricted ranking
India and Indonesia top the full efficiency tables — on the order of 20–26 years of life per $100 or per percentage point of GDP — because spending is extremely low while life expectancy is still in the low seventies.
They are standout cases for a different reason: they reveal the structural trap of the metric.
- A low denominator inflates the ratio even when absolute longevity remains well below rich-country levels.
- Much of their health gain historically came from cheap population-level interventions, which produce large returns early in the health transition.
- High “efficiency” here can coexist with major unmet medical need and limited access to complex care.
These countries belong in the full ranking, but they should not be used as the main benchmark for evaluating the United States, Japan or Southern Europe. That is exactly why the 78-year peer-group filter is necessary.
The United States is moving further away from its peers
The most striking feature of the comparison is the trajectory of the United States. In 2023, the country spent approximately $12,023 per person on healthcare, more than twice the average of the 51 countries included in this comparison.
Despite this extraordinary level of spending, life expectancy in the United States was approximately 79.3 years. The average across the countries in the comparison was slightly higher, at 79.74 years, despite average healthcare spending of only $3,986 per person.
The contrast becomes even clearer when the United States is compared with other high-income countries:
- Japan recorded a life expectancy of 84.71 years while spending approximately $4,806 per person.
- South Korea reached 84.33 years with spending of about $4,055 per person.
- Italy reached 83.72 years while spending around $4,046 per person.
- Spain recorded 83.67 years with healthcare spending of approximately $3,901 per person.
- France, Germany, Canada and the United Kingdom also achieved longer life expectancy while spending substantially less per person than the United States.
The United States did not always stand so far apart. In the 1970s, its results were closer to those of other developed economies. Over time, however, spending rose much faster than life expectancy, and the country’s relative position gradually deteriorated.
Several factors contribute to this paradox:
- High prices for medical services, drugs and procedures mean that additional spending does not necessarily buy a proportionally greater volume of care.
- A fragmented financing and insurance structure generates substantial administrative costs and complicates access for patients.
- Unequal access means that some people delay diagnosis or treatment because of cost, insurance status or geographic availability.
- High rates of obesity, metabolic disease, opioid-related deaths, firearm deaths and traffic fatalities reduce average life expectancy.
- Major economic and geographic inequalities create large differences in health outcomes between population groups.
- A considerable share of spending is directed toward advanced treatment after disease has developed rather than preventing illness earlier.
The fundamental problem is therefore not a lack of money. It is the limited efficiency with which exceptionally high spending is converted into longer and healthier lives across the whole population.
Higher spending helps, but only up to a point
Over the past several decades, wealthy countries have increased their healthcare spending while their populations have generally lived longer. Vaccination, improved sanitation, earlier diagnosis, better cardiovascular treatment, intensive care and advances in neonatal medicine have all contributed to this progress.
However, data covering the period from 1970 to 2023 show that a larger healthcare budget does not automatically translate into proportionally longer lives. Once a country has established broad access to essential medical services, further improvements increasingly depend on how efficiently the system uses its resources and on the conditions in which people live.
The overall pattern can be summarized in several points:
- Countries starting with relatively low healthcare spending can achieve major gains by investing in basic medical care, vaccination, sanitation, maternal care and the treatment of common diseases.
- In countries with mature healthcare systems, each additional increase in spending tends to produce smaller improvements because many of the most accessible health gains have already been achieved.
- The final outcome depends not only on how much a country spends, but also on what it purchases, who can access care and how effectively the system prevents disease before expensive treatment becomes necessary.
Life expectancy is shaped largely outside the hospital
Medical care is essential, particularly in emergencies and in the treatment of infections, cancer, cardiovascular disease and chronic conditions. But healthcare systems do not operate in isolation.
A population’s life expectancy is also influenced by social, environmental and behavioural factors that may begin affecting health decades before a person enters a hospital.
Some of the most important factors include:
- Living and working conditions influence chronic stress, exposure to pollution, physical safety, sleep and opportunities for recovery.
- Access to nutritious food and environments that support physical activity can reduce the development of obesity, type 2 diabetes and cardiovascular disease.
- Education and preventive care can help people identify risks earlier and avoid behaviours associated with premature disease.
- Policies concerning tobacco, alcohol, road safety, firearms, pollution and food quality can influence mortality across entire populations.
- Accessible primary care allows health problems to be identified before they lead to hospitalisation, disability or expensive complications.
- Income security, housing quality and social support can affect both exposure to disease and the ability to obtain timely treatment.
This means that advanced medicine cannot fully compensate for ineffective prevention or an unhealthy social environment. A system focused primarily on treating disease after it appears may consume enormous resources while achieving worse population outcomes than a system that reduces risk earlier.
The chart does not prove a simple causal relationship
The comparison between healthcare spending and life expectancy is compelling, but it requires careful interpretation. It does not prove that higher medical spending shortens life, nor does it suggest that simply cutting healthcare budgets would improve outcomes.
Several limitations must be considered:
- The countries differ in population structure, income inequality, lifestyle, disease burden and the organisation of healthcare.
- Life expectancy includes deaths from causes over which hospitals and doctors may have only limited influence.
- Spending per person does not reveal how funds are distributed between prevention, primary care, hospital treatment, pharmaceuticals and administration.
- National averages can hide major differences between regions, income groups and communities.
- Healthcare expenditure is adjusted for differences in living costs, so it should not be interpreted as a simple comparison of nominal national budgets.
- The COVID-19 pandemic affected mortality patterns during the later years of the period and influenced countries to different degrees.
The chart should therefore be understood primarily as a comparison of system-level efficiency and population outcomes, not as proof that each additional dollar produces a specific number of additional months of life.
It also uses life expectancy as a broad proxy for population health. This is useful, but incomplete. Two countries with similar life expectancy may still differ substantially in healthy life expectancy, disability rates, quality of care and the number of years people spend living with chronic disease.
More medicine does not always mean more health
The history of the past five decades shows that medical progress has been one of the foundations of longer life. At the same time, the United States demonstrates that even exceptionally high expenditure cannot guarantee the best population outcomes.
What matters is not only the amount of money in the healthcare budget, but whether the system:
- provides early and equitable access to medical care;
- invests in prevention and accessible primary care;
- controls the prices of drugs, procedures and administration;
- reduces avoidable causes of premature death;
- supports healthier living conditions throughout the population;
- measures success through health outcomes rather than the volume of services delivered.
Longevity is produced by the whole society, not only by its hospitals. The most effective healthcare system is not necessarily the one that spends the most. It is the one that converts its available resources most efficiently into prevention, access, safety and additional years of healthy life.
Sources
Primary data:
- Global Health Expenditure Database (GHED) – World Health Organization — healthcare spending compiled under the System of Health Accounts (SHA 2011)
- Health expenditure and financing (SHA) – OECD — comparable spending series for OECD countries, including longer historical coverage
- World Population Prospects – United Nations, Population Division — period life expectancy at birth
- World Development Indicators – World Bank — WHO health spending republished as indicator
SH.XPD.CHEX.PP.CD(current international $, PPP)
Aggregators and visual summaries used in preparing this article:
- Life expectancy vs. health spending – Our World in Data
- Total healthcare expenditure as a share of GDP – Our World in Data — current health expenditure (% of GDP), WHO Global Health Observatory
- Healthcare spending – Our World in Data
- Life expectancy vs. healthcare spending, 1970–2023 – Visual Capitalist
The country-level figures shown in the charts and tables for 2023 are drawn from these international datasets via Our World in Data. The efficiency rankings — years of life expectancy per $100 of healthcare spending, and years of life expectancy per 1 percentage point of GDP devoted to health — are calculated from those figures for this article. The peer-group efficiency rankings (USD per person and % of GDP) restrict the sample to countries with life expectancy of at least 78 years. Ukraine is excluded from the GDP-share comparison because 2023 current health expenditure as a share of GDP is unavailable in the series used here.